```{r setup, include=FALSE}
if (!require("knitr")) {
install.packages("knitr")
library(knitr)
}
if (!require("shiny")) {
install.packages("shiny")
library(shiny)
}
if (!require("ggplot2")) {
install.packages("ggplot2")
library(ggplot2)
}
if (!require("tidyverse")) {
install.packages("tidyverse")
library(tidyverse)
}
if (!require("dplyr")) {
install.packages("dplyr")
library(dplyr)
}
knitr::opts_chunk$set(echo = TRUE,
warning = FALSE,
result = TRUE,
message = FALSE,
fig.align='center',
fig.pos = 'ht')
```
# Introduction
You have two package options for building Shiny dashboards: flexdashboard and shinydashboard.
## **flexdashboard**
Easy interactive dashboards for R that ``use R Markdown to publish`` a group of **related data visualizations** as a dashboard, support a wide variety of components including
* `htmlwidgets` - A framework for embedding JavaScript visualizations into R;
* `base`, `lattice`, and `grid` graphics;
* `tabular data`;
* `gauges` and `value boxes`;
* `text annotations`.
A flexdashboard is flexible and easy to specify a row and column-based layouts with re-sizing to fill the browser. `It is just a document that looks like a dashboard. However, it
* contains some specific widgets designed to work in a dashboard layout.
* offers storyboard layouts for presenting sequences of visualizations and related commentary
* can use shiny to drive visualizations dynamically by specifying `runtime: shiny` in the YAML head.
* can only run interactive code client-side (in embedded JavaScript).
## **shinydashboard**
An R package for creating dashboard-style layouts with Shiny that uses
* Bootstrap (a free open source front-end-framework develop faster, easier, responsive web pages) for layout;
* uses AdminLTE, which is a theme built on top of Bootstrap.
Unlike `flexdashboard`, **shinydashboard** has three structured components:
```
## app.R ##
library(shiny)
library(shinydashboard)
ui <- dashboardPage(
dashboardHeader(),
dashboardSidebar(),
dashboardBody()
)
server <- function(input, output) { }
shinyApp(ui, server)
```
`shinydashboard` needs a server behind it to execute R code on user input. It can implement a dashboard layout that contains some specific widgets designed to work in a dashboard layout. It can also run interactive code either by processing server-side (in R) or client-side (in embedded JavaScript).
## Three Web Application Terms
* **Responsive**: adapting layouts to a variety of screen and window sizes.
* **Interactive**: elements that react to your actions on the site.
* **Reactive**: automatically checking and updating data from the server without refreshing the website.
# Using Flexdashboard
This note outlines the flexdashboard using shiny.
## Components
We can use flexdashboard to publish groups of `related data visualizations` as a dashboard. A flexdashboard can either be static (a standard web page) or dynamic (a Shiny interactive document). A wide variety of components can be included in flexdashboard layouts, including:
* Interactive data visualizations based on htmlwidgets.
* R graphical output including base, lattice, and grid graphics.
* Tabular data (with optional sorting, filtering, and paging).
* Value boxes for highlighting important summary data.
* Gauges for displaying values on a meter within a specified range.
* Text annotations of various kinds.
## Basic Flexdashboar Layout
The layout design is relatively simpler than that of shinydashboard.
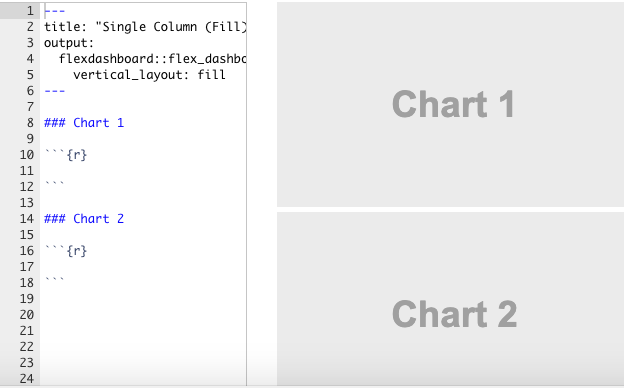
### Single Column
Flexdashboards are divided into columns and rows, with output components delineated using `level 3 markdown headers (###)`. By default, dashboards are laid out within a single column, with charts stacked vertically within a column and sized to fill available browser height.
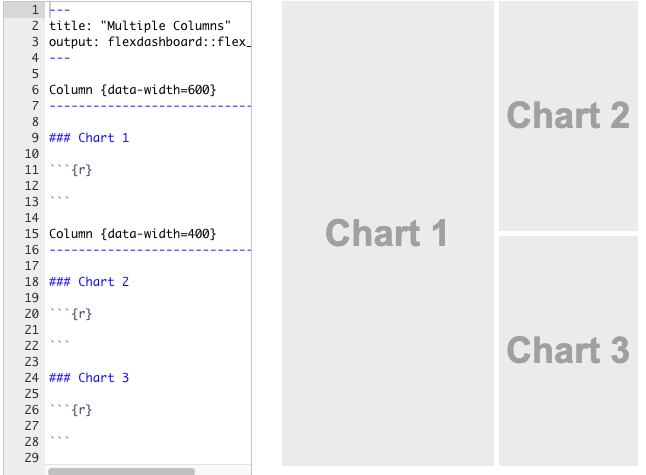
 ### Multiple Column
To layout charts using multiple columns you introduce a `level 2 markdown header (--------------)` for each column.
### Multiple Column
To layout charts using multiple columns you introduce a `level 2 markdown header (--------------)` for each column.
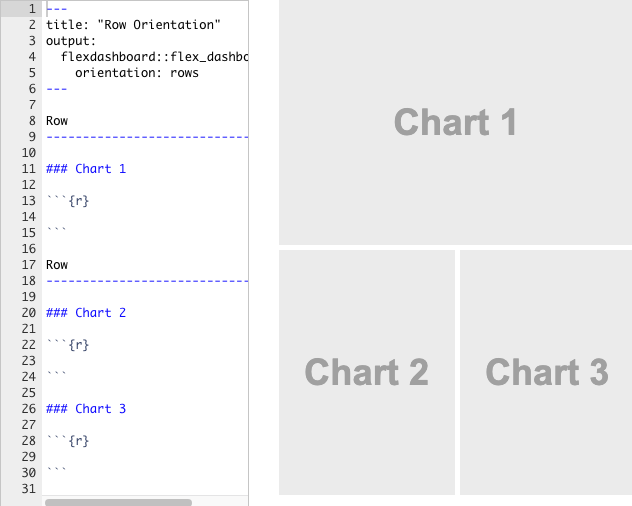
 ### Row Orientation
We can also choose to orient dashboards row-wise rather than column-wise by specifying the `orientation: rows` option.
### Row Orientation
We can also choose to orient dashboards row-wise rather than column-wise by specifying the `orientation: rows` option.
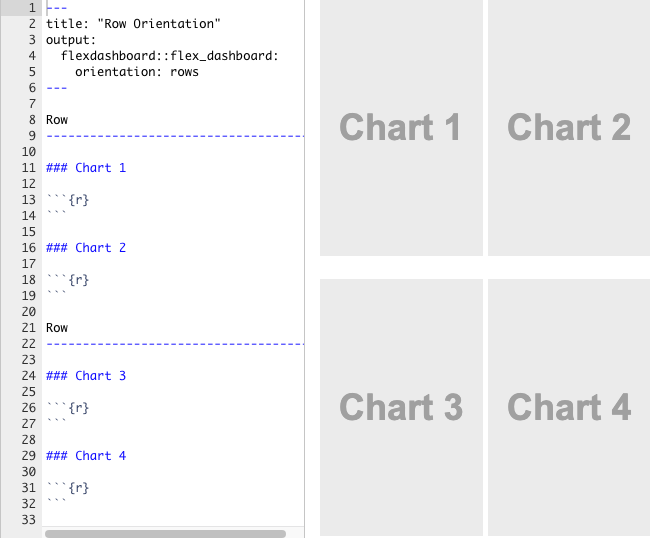
 ### Grid Layout
This layout uses the default `vertical_scroll: fill` behavior. It might be preferable to allow the page to scroll (vertical_layout: scroll).
`orientation: rows` is used to ensure that the chart baselines line up horizontally.
### Grid Layout
This layout uses the default `vertical_scroll: fill` behavior. It might be preferable to allow the page to scroll (vertical_layout: scroll).
`orientation: rows` is used to ensure that the chart baselines line up horizontally.
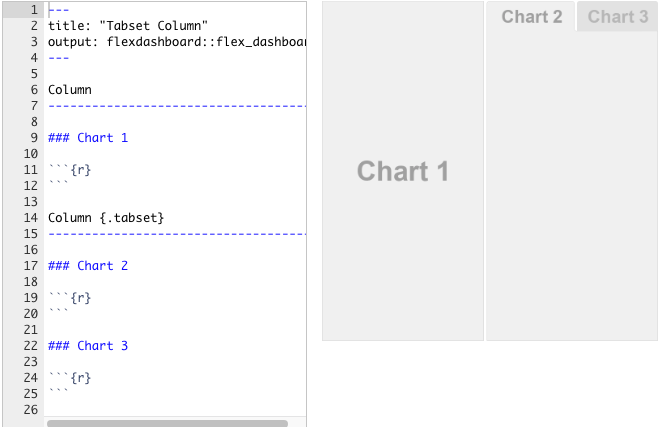
 ### Tabset Column
This layout displays the right column as a set of two tabs. Tabs are especially useful when you have a large number of components to display and prefer not to require the user to scroll to access everything.
### Tabset Column
This layout displays the right column as a set of two tabs. Tabs are especially useful when you have a large number of components to display and prefer not to require the user to scroll to access everything.
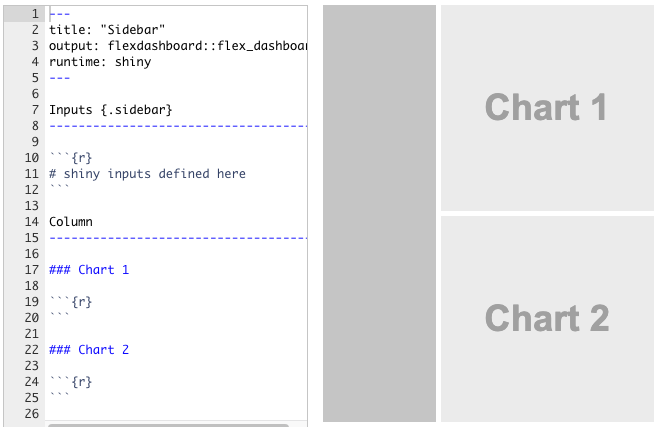
 ### Input Sidebar
This layout demonstrates how to add a sidebar to a flexdashboard page (Shiny-based dashboards will often present user input controls in a sidebar). To include a sidebar you add the `.sidebar` class to a `level 2 header (-------------------)`:
### Input Sidebar
This layout demonstrates how to add a sidebar to a flexdashboard page (Shiny-based dashboards will often present user input controls in a sidebar). To include a sidebar you add the `.sidebar` class to a `level 2 header (-------------------)`:
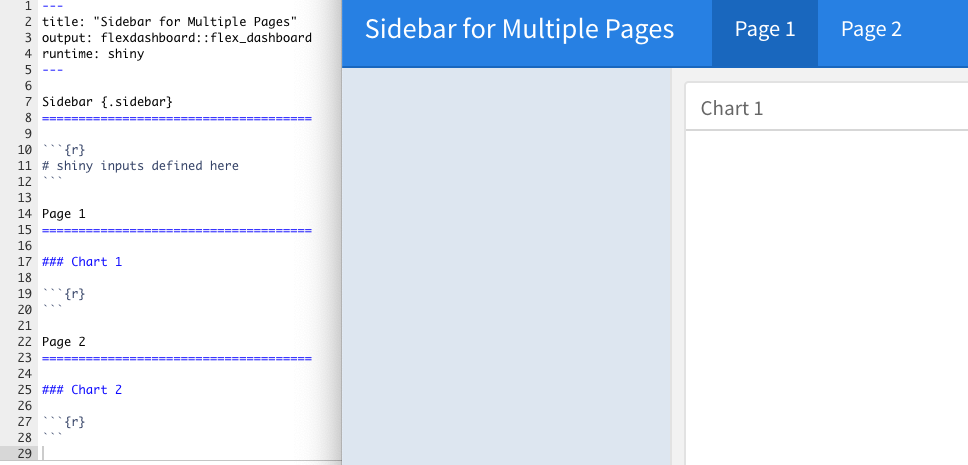
 ### Global Input Sidebar
If we have a layout that uses Multiple Pages you may want the sidebar to be global (i.e. present for all pages). To include a global sidebar you add the .sidebar class to a `level 1 header (======================)`:
### Global Input Sidebar
If we have a layout that uses Multiple Pages you may want the sidebar to be global (i.e. present for all pages). To include a global sidebar you add the .sidebar class to a `level 1 header (======================)`:
 # Storyboards
Storyboards are an alternative to the row and column-based layout schemes described above that are well suited to presenting a sequence of data visualizations and related commentary.
## Storyboard Basics
To create a storyboard layout you do the following:
* Add the storyboard: true option to the dashboard.
* Include a set of `level 3 (###)` dashboard components. Each component will be allocated its own frame in the storyboard, with the section title used as the navigation caption.
The basics of creating storyboards are explained below. For a more complete example, see the HTML Widgets Showcase storyboard.
## Storyboard Pages
We can layout one or more pages of a dashboard as storyboards and then use traditional row and column layouts on the other pages. To do this, you exclude the storyboard: true option and instead add the `{.storyboard}` class to pages you want to layout as storyboards.
## Commentary
We may wish to add commentary alongside the frames in your storyboard. To do this you add a horizontal rule separator (***) after the main body of frame content. Content after the separator will appear in a commentary sidebar to the right.
\
\
# Storyboards
Storyboards are an alternative to the row and column-based layout schemes described above that are well suited to presenting a sequence of data visualizations and related commentary.
## Storyboard Basics
To create a storyboard layout you do the following:
* Add the storyboard: true option to the dashboard.
* Include a set of `level 3 (###)` dashboard components. Each component will be allocated its own frame in the storyboard, with the section title used as the navigation caption.
The basics of creating storyboards are explained below. For a more complete example, see the HTML Widgets Showcase storyboard.
## Storyboard Pages
We can layout one or more pages of a dashboard as storyboards and then use traditional row and column layouts on the other pages. To do this, you exclude the storyboard: true option and instead add the `{.storyboard}` class to pages you want to layout as storyboards.
## Commentary
We may wish to add commentary alongside the frames in your storyboard. To do this you add a horizontal rule separator (***) after the main body of frame content. Content after the separator will appear in a commentary sidebar to the right.
\
\